CFD simulation, built for exploring
We run high-fidelity CFD simulations of your equipment and turn the results into decisions your team can act on, not one more report forgotten in a folder.
From geometry to decision in four steps
Share CAD models or drawings along with the operating conditions and the questions you need answered.
Our engineers build and validate a CFD model, running the range of scenarios that matters to your decision.
A clear report, visualizations and specific recommendations, not just raw solver output.
Explore design variants quickly, backed by simulation, before you commit to physical changes.
Will your pump sump form a vortex?
A real example of how we work: predicting suction vortices in a pump sump, based on a published benchmark experiment. Drag the controls to change the flow rate and the water level, and watch the risk verdict update.
Schematic side elevation, benchmark geometry (450 × 300 mm passage, 150 mm outer-diameter suction pipe). Not to scale.
Where this sump can run without forming a vortex, the whole design space, not just the point you picked.
Click or drag on the chart to set an operating point. The hollow markers are points we actually simulated.
Air-entrained vortex predicted
Based on the critical-submergence lines fitted in Okamura et al. (2007), expressed in Froude form. Measured on the benchmark model only and carried over here by Froude similarity as an indication, not as a validated criterion. On a real project we use TSJ S002 / ANSI/HI 9.8, or run the full transient CFD case.
Benchmark case 1 — Okamura et al. (2007), Table 1
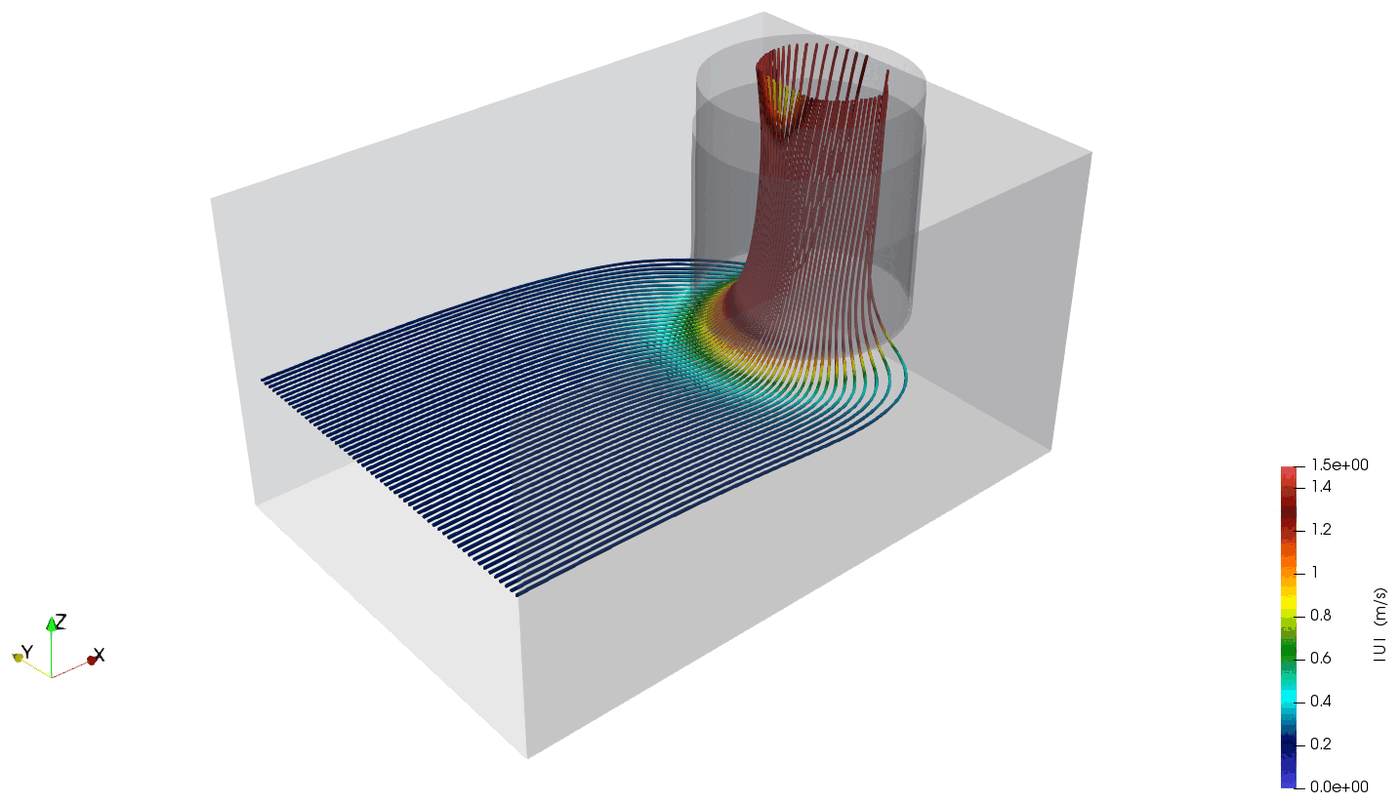
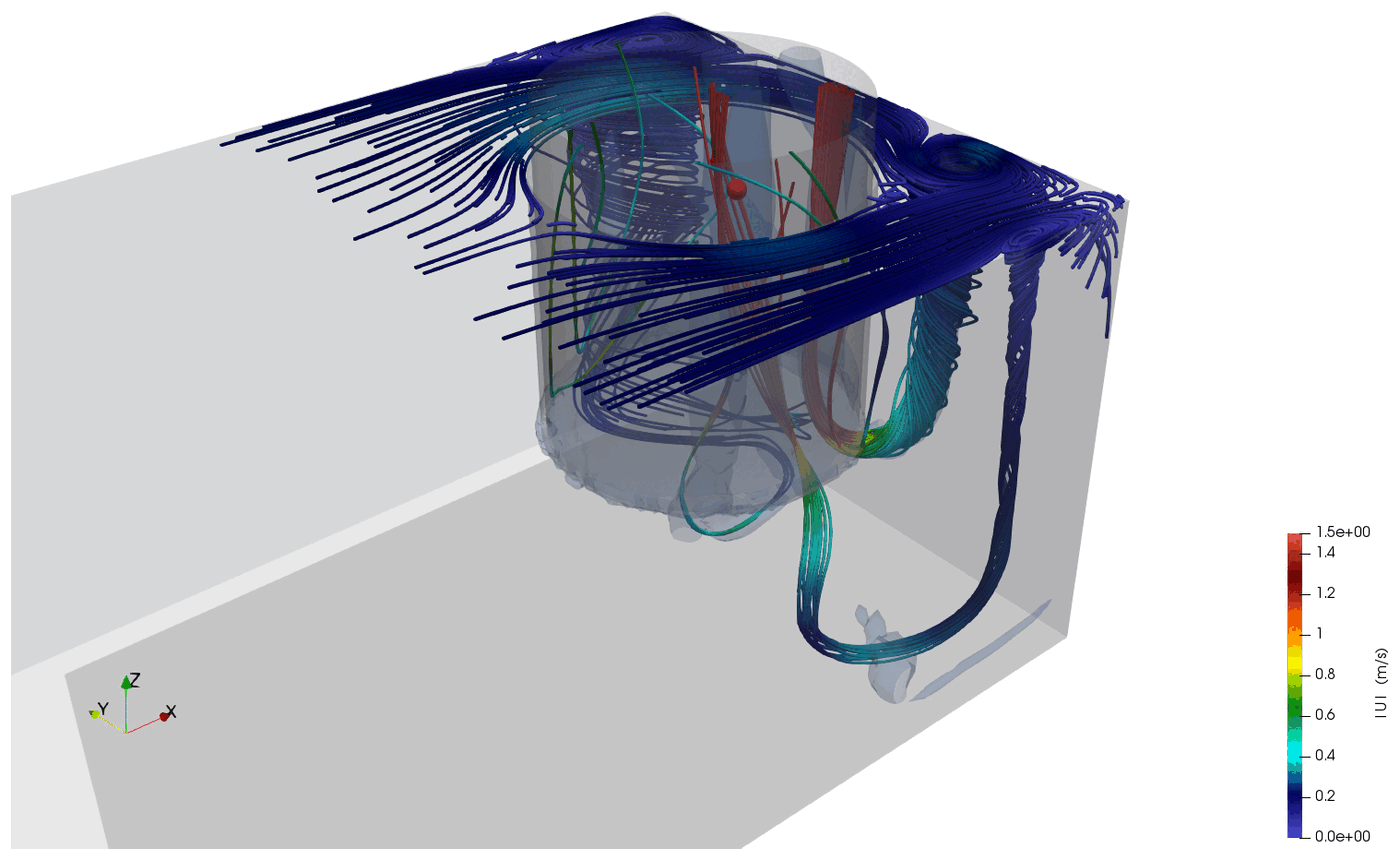
Coarse mesh, 1,500 iterations. Steady RANS does not fully converge on this flow, the vortex cores genuinely move, so the velocity field is settled but vortex strength is reported as a range across the writes.
What you actually walk away with
Results, assumptions and validation against your operating data, written for engineers and for the people who decide.
Flow fields, temperature maps and pressure losses you can share internally or with stakeholders.
Concrete changes ranked by expected impact, not just "here is what happens".
A model you can bring back to us (or to your own team) to explore future design changes faster.
Tell us about your equipment and about the decision you need to make. We will tell you honestly whether CFD is the right tool before you spend a cent.
contato@vorticis.com.br